

Signal level. The large variations of signal level have to be fully understood in order to be in command of the mixing process. The first step is to have a clear understanding of dB (deci-Bell).
dB is how our ears hear sound as a ratio. (also refer to dB page)
1.26 X watts power change (1dB) is the smallest sound change we can hear.
2 X watts power change (3dB) is heard as a slight difference.
10 X watts power change (10dB) is heard as 2 X as loud to our ears.
100 X watts power change (20dB) is heard as 4 X as loud to our ears.
Gain. A microphone converts the sound to voltage. The mixer increases and modifies the signal voltage. Increasing the signal voltage is described as 'gain'. A mixer functions with signal voltage but with very little current / amperes.
The power amplifier increases the signal voltage to a much higher level and adds a large amount of current / amperes to drive the speaker. Volts X amperes = watts (power). We hear the power as sound from the speaker described in dB.
0dB can be referenced to any particular signal voltage or output power (watts).
The above graph shows a comparison of watts referenced to 0dB as 1W.
Watts power = (volts X amperes)
Increasing 10 X voltage, increases 10 X amperes. 10V X 10A = 100W and so on.
When working with mixers and effects we describe the audio signal as its voltage or gain.
Changing the signal voltage (gain) changes the loudness power we hear.
Increasing the signal voltage (gain) X 2 causes the power to be increased X 4.
2 X voltage change in the mixer is 4 X watts change in power amplifier (6dB).
10 X voltage change in the mixer is 100 X watts change in power amplifier (20dB).
This simply shows that increasing the V X 10 also increases the A X 10. Therefore, the watts power is increased by 100. We hear the power increase as a sound change of 20dB.
This is the reason when describing dB referenced to voltage / gain the dB numbers are X 2 compared to describing dB referenced to watts power. By looking closely again at the above graph
(100W is 20dB) (10V is 20dB) and so on.
(100W is 20dB) (100V is 40dB) and so on.
Understanding dB is simple, but it takes 4 hours practice to use it. Once learnt, never forgotten.
Riding a bush bike is simple, but it took 4 hours practice to do it. Once learnt, never forgotten.
1. VU (volume units) and dBu (deci-Bell units)
Line level 0VU is the internal signal level of mixing consoles, signal processors, effects units, and recording hardware and is a reference that allows hardware to be interconnected. 0VU is verbally pronounced as 'zero (or Oh)' for 0 and the V U are said as the letters.
0dB (m) (V) (W) etc., means that the 0 is a reference to a stated voltage or watt.
0dBm = 0dBu = 0.775 volt (775 milli Volt). This 0VU reference was adopted in early audio history to represent a signal voltage of 775 mV RMS as 'line level'. 0dBm refers to 1 milli-watt across 600 Ohms which co-insides with being 775 mV. This reference applied to valve technology pre 1960 and no longer applies. This dBm and dBu as 0.775V is confusing and should have been deleted many years ago.
0VU should be referenced to 1V as dBV.
Professional audio 0VU +4dBm (1.23 V)
Professional audio should be 0VU = +6dBV (2 V) (if I was dictator)
Domestic audio 0VU is -10dBV (316mV). The very low line level of -10dBV (316mV) is the result of portable CD Walkman and MP3 iPods being powered from 2 x 1.5V batteries (3V).
A 3V supply rail is small therefore the signal level has to be small.
0dBFS (0dB Full-Scale) applies to digital only. 0dBFS refers to the maximum level of a digital audio signal. Therefore, dBFS numbers are minus - only. &For example, an 8 bit processor has 1 1 1 1 1 1 1 1 for representing the maximum level of an audio signal. And 0 0 0 0 0 0 0 0 for representing zero audio level. 8 Bits gives 256 steps. When the digital 1's and 0's are converted back to analogue as a voltage, that analogue voltage signal can be anything we choose it to be. This means, 0dBFS does not relate to an external analogue voltage reference, outside of whatever we want maximum to be.
0dBFS = maximum signal voltage (full power)
-3dBFS = 70% signal voltage (0.5 power)
-6dBFS = 50% signal voltage (0.25 power)
16 Bit, 32 Bit, 64 Bit, simply increases the number of steps to represent an audio signal, including greater dynamic range, to almost infinity. But, modern mixing practises rarely use this greater number of bits (processing power) to enable us to hear greater dynamic range and realism in music. By adding extreme hyper-dynamic compression to the music, the music can be kept as close to 0dBFS as possible, to make the music appear as loud as possible.
Also, digital audio allows hyper dynamic-compression (removal of all dynamic range from music) to be taken to greater extremes than was previously possible with older analogue technology. This practise may artistically suit a narrow range of simple, non-complex music but, as many argue, the practise of removing all dynamic range from music has an economic destructive effect on the music industry as a whole.
2. Signal level
Understanding signal level and dB is essential to obtain the maximum dynamic range from the mixing process. Without understanding signal level and dB it is not possible to obtain the maximum dynamic range from the mixing process. Therefore, one is forced to use excessive compression to squash the dynamic range to stop everything from being distorted.
The Rails. The majority of analogue professional mixers and effects have an internal supply voltage of (+15VDC & -15VDC), referred to as 'The Rails'. The total supply voltage between the rails is 30V. High-power professional amplifiers have a rail supply of 80V to 160V.
The common test for the audio signal of a continuous sine wave is A 440Hz or 1kHz.
It can be seen in the above pic that the maximum AC music signal is limited by the rails. The peaks of the sine wave cannot go further than the rail limit of +15V and -15V. This is described as
30V peak to peak (30V P/P).
RMS (Root Mean Square) is a mathematical averaging of the AC music over 1 second. The approx RMS V can be obtained by dividing the P/P / 3 (30V / 3 = 10V RMS). However the exact formula is (P/P / 2) X 0.707
If the signal is increased, the peaks of the sine wave will be clipped by the rails. Extreme clipping is used by guitar players as 'sustain'. Sustain simply means sound remaining at the same level, by being clipped. Valve/tube amplifiers give rounded soft clipping whereas solid-state amplifiers clip with precise sharp edges. There should be zero difference between a solid-state and valve/tube pre-amplifier when not being clipped. Any difference is the result of imposed distortion or noise.
Many solid-state pre-amps and power-amps have short circuit protection that is momentarily activated by clipping, which can put extreme spikes into the signal. Many roadie sound engineers deliberately drive PA's into clipping to obtain an aggressive distorted sound for heavy metal music.
6dB Headroom. 6dB is double or half of the voltage. To insure against the possibility of clipping, the audio signal must not go above 1/2 the rail voltage. The maximum signal at the onset of clipping is 10V RMS therefore the audio signal must not go above 5V RMS.
By paying close attention to the above pic it can be seen that music is very complex with transient peaks. Depending on the type of instrument the transients can be well over 20dB of the music body. However, transients can be peak limited to within 20dB without noticeable change to the music. 10dB transient peak limiting is often accepted. 10dB transient allowance puts the body of the music at 1/3 below 5V at approx 1.23V RMS (+4dBu)
Transients are so short in duration that they may not be detected by mechanical analogue VU meters. Solid-state display meters can have clipping detect, showing transients with slow decay, including the RMS body of the music. Many lager mixing consoles have small peak meter readings on each channel, on top or beside the faders.
By paying close attention to the above pic is simple to obtain a dynamic range of 40dB but difficult to obtain a dynamic range of 60dB. To obtain 60dB dynamic range is a juggling act between the maximum allowable signal level and the composite noise floor. It is difficult, but not impossible, to get the collective noise floor below 1mV (-60dBV), which is the minimum to obtain a 60dB dynamic range. The graph below is a general overview of the juggling act.
Noise floor. Each brand markets it's products with claims of virtually zero noise level, often at the theoretical limit of below 100uV, which easily allows for a dynamic range of 90dB. BUT, the noise floor is limited by component physics which product manufacturers have little to zero control over. Composite noise is multiplied by the total amount of hardware in the mixing recording and playback chains.
3. Attenuators log / linear
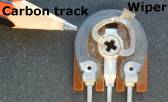
Attenuation means to stop, resist or reduce. A water tap is an attenuator. There are stepped attenuators that consist of switches in 1 to 3 dB steps. Most attenuators are smooth moving controls for gain volume and EQ (rotary potentiometers and straight faders).
A simple carbon track made by a pencil will conduct electricity and function as a resistor. A smooth attenuator has a wiper that moves along the carbon track, as in the pic below. However, the materials used in high quality pots and faders are more complex. By looking at the pic below it can be seen that the signal level comes in at the top of the attenuator. The wiper selects a smaller signal level along the track.
Linear, as the word describes, is 50% of wiper attenuator movement selecting 50% of the signal - direct 1:1 attenuation. Linear is used for EQ and most calibration controls. Linear controls are often set in the middle (half-way) position when used for EQ, bass, mid, treble and balance controls.
Log. Logarithmic (log) means the first 50% of fader movement selects 10% - 20% of the signal level, depending on log curve. Log is used for volume and gain adjustment, allowing for easy management of small signal levels. However, log does not allow for easy management of large signal levels at the top of the attenuator movement. The top 20% of attenuator movement makes a large 50% change to the signal level, which is difficult to manage.
The above pic shows a comparison between log and linear faders at 50% movement. The reference, 0dB, is at the top of the faders. The attenuation is written as -dB attenuation down each fader, shown for comparison only. The faders attenuate the signal level and therefore there is a pre-amp after each fader to re-amplify the signal to 0VU. The graph below shows the correct reference for the 0dB markings beside the faders.
0dB reference markings are on all controls of the mixer. When all the controls are set at the 0dB mark, the signal level that comes into the mixer is the same level that leaves the mixer. This is described as the default or re-set position. From the reference of 0dB on the log fader, the signal gain can be increased +10dB at the top of the fader.
Repeat - By paying close attention to the above pic it can be seen that a log taper allows for easy manual detailed adjustment at low signal level. The first 50% of the physical movement from the bottom enables approx 10% (-20dB) of the available signal level to be easily managed. The top 50% of the fader movement controls approx 90% of the signal level. This top 50% movement of the fader gives the feeling of being over-reactive (similar to an on/off switch).
Log taper is best suited to the lower 50% of movement for accurate and detail control of signal level. Log taper faders are intuitive for 50% of recording engineers, whereas & linear taper faders are intuitive to the other 50% of recording engineers.
Fader design problems. If you pre-adjust the incoming signal level to the fader to have the maximum signal required when the fader is at top position, then linear taper will give the best mechanical control for obtaining accuracy and detail. 50% of the downward movement enables 50% (6dB) of the available signal to be managed.
The most important design function missing on mixers is a switch to change the fader taper from log to linear. Linear taper faders require a gain attenuation control to adjust the correct operating signal for the fader. Linear faders are better suited to live mixing, whereas log faders are better suited to recording. The failure of console manufacturers to recognise and provide log/lin fader adjustment is one of the greatest limitations of mixer management.
4. Panning
Mono, the same sound from both left and right speakers, introduces an acoustic comb-filter effect which is harmonically pleasing but reduces high frequency energy, presence and sharpness. Panning to one side, so the sound comes from a single point, increases sharpness and sounds closer.
A clear centre image can be created with a stereo mic or 2 mics panned hard left and right in close x y orientation. Experimentation will find the best result.
Mixing for recording is often done on 2 small speakers at close range (near-field). Speakers that are 4 metres (12ft) or less apart is acceptable for a centre image (mono) with minimal loss of fidelity. However, for live productions, speakers may be 12 metres (36ft) or more apart. Live mixing in mono, the same sound from left and right speakers, at large distances apart introduces a greater comb-filter effect and fidelity will noticeably deteriorate.
Facing speakers directly forward also adds excessive reflection from walls and further reduces intelligibility. Many roadie sound engineers mix in mono in front of only one speaker stack. The speaker system should be turned inward to improve directivity and minimise wall reflection. Wherever possible, live mixing should be from the centre in stereo, where sound from left and right intersects, at a distance no further back than where direct sound from the speakers is equal to the reflected reverberant energy of the room (critical distance).
Spatial movement. It is important to pay attention to how a pan control functions. Most domestic pan controls simply reduce the level to the opposite channel to which the knob points to. However, pan controls on professional mixers lift by +3 the direction the knob points to, as well as reducing the opposite track toward zero. This allows for even spatial movement during panning. The majority of music recordings do not require spatial movement from panning. Live productions do benefit from spatial movement effects.
Spatial movement is essential for cinema recording. But, as a person or the bass rumble of a space ship (did I say space ship?) moves across the screen, it sometimes sounds wrong. Console manufacturers fail to provide attenuation adjustment for the pan centre point to -6dB for tailoring spatial movement. Most are fixed at -3db.
Often for a sound image to give a smooth movement from centre to left or right, an increase of 6dB is required. Many skilled recording engineers prefer to use separate channels with automated faders, programmed for obtaining the desired outcome for spatial movement.